I asked what others did for benchmarking in my last post. Here are the replies on Twitter in a semi-coherent edited form. If I missed any replies, I blame Twitter, whose interface is a magical maze.
First there were some FPS vs. SPF comments:
Richard Mitton: If you’re not measuring in milliseconds then you’re doing it wrong.
Christer Ericson: Yes, ms, not FPS. FPS is not a linear unit for the artists (or anyone).
Marc Olano: FPS isn’t linear. Usual definition of median averages middle 2 for even samples = also wrong. Use ms.
Morgan McGuire notes: FPS *is* a good measure if what you care about is interaction or visual smoothness. SPF is good for computational efficiency.
I replied to Richard & Christer: I’m interested in your reaction to the use of median vs. mean. FPS vs. SPF irrelevant for relative performance.
I also changed the original post to talk about milliseconds instead of frames, to avoid this facet of the discussion.
Christer Ericson: It’s important to catch the spikes, so in the context you’re talking about I would do max. Or mean+variance. Also, don’t think I’ve ever, for profiling reasons, looked at any average. You always look at a specific frame.
Timothy Lottes: I’m personally only interested in worst case ms/frame.
Cass Everitt: Agree with those that concentrate on worst times.
Eric Haines: Right, it depends what you’re looking for, e.g. don’t drop below 60 FPS. I’m mostly warning against using mean.
I added a note to the original post about tracking the max, which makes sense if you’re trying to guarantee a frame rate.
Tobias Berghoff, who benchmarks consoles:
I use min/max/med the most. Averages really only come into play when I need more digits. I spend significant amount of time below the 0.5% mark when wearing my platform tuning hat. I don’t miss trying to get sensible numbers out of PC h/w. But this also comes into play when measuring very short processes. When something only takes a couple of microseconds, you often end up oscillating between states that make the distribution multi-modal. Median won’t catch small shifts.
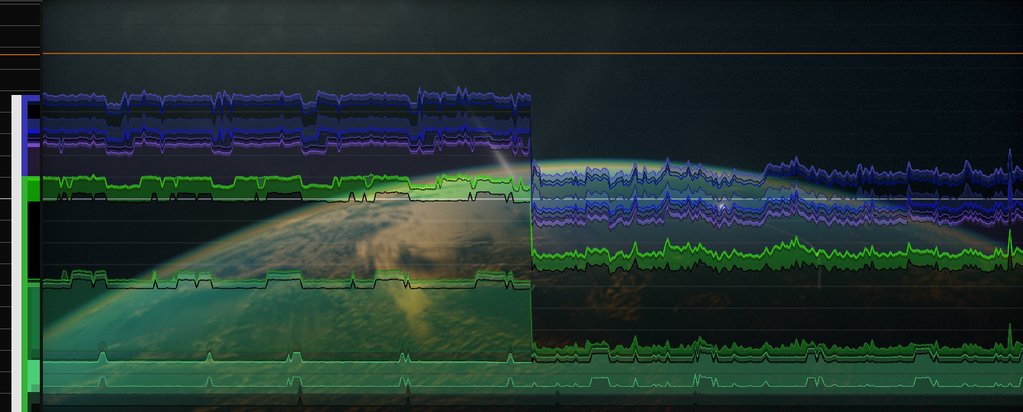
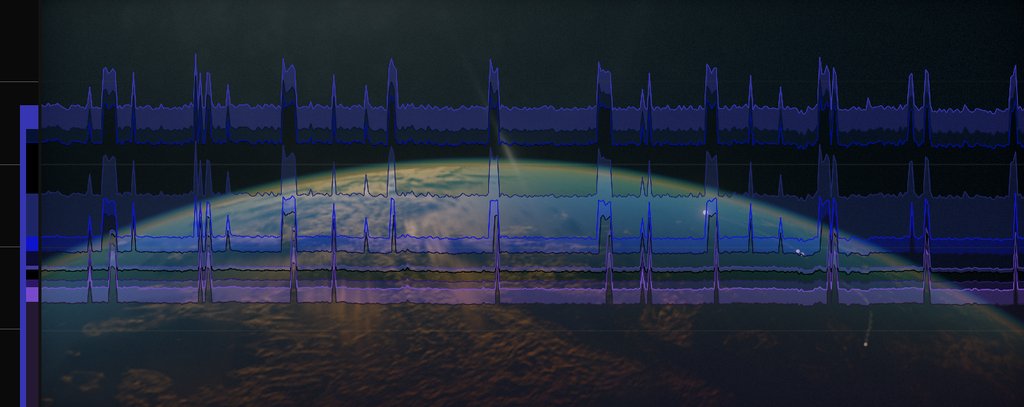
cupe: Stacked color-coded graph of nested timings (or a subtree of it). Usually unfiltered for analysis, avg for comparisons. Hierarchy is on the left, tooltip displays e.g. “scene/fluid/poisson”, click to restrict. Horizontal lines are milliseconds, orange line is 16.6 ms.

E.g. click the big violet bar to see only post (and zoom in to stretch 4ms to screen):

Javdev: We use a profiler, Adobe Scout, select multiple frames & see which code is most expensive & iterate it to prevent frame drops.
Björn Blissing: One option is to plot a histogram over the captured data. Reveals if your max/min are outliers or more common occurrences.
Michael Marcin: Try always running circular etwtrace and when frame time dips save and examine the trace.
Mikkel Gjoel: We filter in viewer. Options for all mentioned, and vsync (as that is what we are shipping).

Fabian Giesen: General order statistics (percentiles etc.) are good. Just a plot of frame durations over frame # is helpful, too! And simply recording all frame durations over a few seconds, sorting them and plotting that is quite handy, too. That gives you all the percentiles (and median etc.) and gives you a feel for the shape of the distribution, which matters. (I’m not very happy with single-value summaries; they lose too much information.)
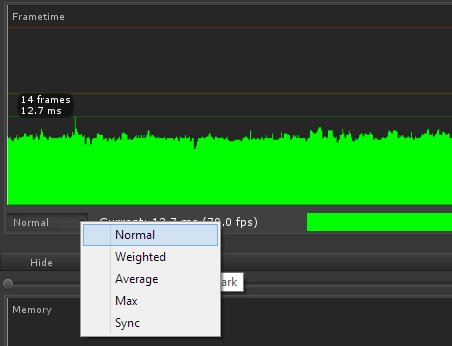
Jaume Sanchez Elias: I like Chrome FPS meter: current, min, max; over time; frequency graph for each framerate

Krzysztof Narkowicz: Min, max, avg and std dev. Percentiles and med would make a nice addition, but it’s a hassle to compute them.
Anton the Mighty: I always use the standard deviation or standard error and indicated what value n sample size is. Most gfx benchs=bad. It’s usually worth also eyeballing actual data in detail because repeating patterns show either cycles or error in timers. Most recently there was something a friend had with the power manager in windows causing a cycling load on the cpu. I also visually check out timing for cpu+gpu functions across frames with apitrace etc. pretty neat.
All for now – feel free to email or tweet me with anything you want to add.