by Sebastien Vandenberghe
With the emerging number of experiences built using WebGL, and all the improvements made in the WebVR/AR space, it is critical to have efficient debugging tools. Whether you are just starting out or are already an experienced developer of 3D applications with WebGL, you likely know how tools can be important for productivity. Looking for such tools, you probably came across Patrick Cozzi’s blog post highlighting the most common ones. Unfortunately, many of these tools are no longer compatible with your project, due to missing WebGL2 features or extensions, such as draw buffers, 3D textures, and so on.
As a core contributor to BabylonJS, working at the engine level, on a daily basis I need to see the entire creation of frames, including all the available information from the WebGL state (Depth, Stencil, Blend, etc.) as well as the list of commands along with their arguments. In order to optimize the engine, I also need information and statistics about memory, draw calls, and primitives. These desires were a big motivation for me to develop SpectorJS. And as we love the WebGL community we decided to make it an Open Source Project, compatible with all existing WebGL 3D engines.
At the end of this walkthrough, you will be able to easily capture and inspect any WebGL frames rendered in your favorites applications. If you have any issues, do not hesitate to report them on Github. To stay informed of all the new features, follow us at @SpectorJS.

Table of Contents
Installation
Always looking to save time, the tool is directly available as a browser extension: Chrome – Firefox – (more browsers are coming soon)
Embedding the library in your application or side-loading the extension are also possible. More information can be found on Github.
Basic Usage
Once installed, you can now on navigate to any website using WebGL, such as the Babylon JS playground, and you will notice the extension Icon turning red in the toolbar.

This highlights the presence of a canvas with a 3D context in the page or its embedded IFrames. Pressing the toolbar button reloads the page and the icon turns green, as Spector is now ready to capture. During the refresh Spector injects additional debug code that collects state and command information, along with other statistics.

Note: We do not enable it by default, so as to not interfere with any WebGL program unless explicitly requested.
Clicking this green button will display a popup helping you to capture frames.
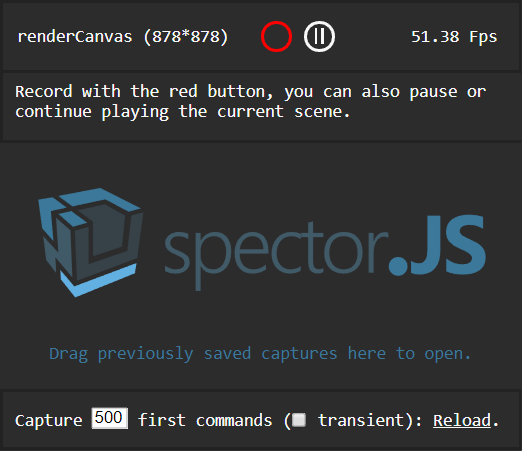
Following the on-screen instructions and clicking the red circle will trigger a capture. If a canvas is selected, you can also, in this menu, pause or play the rendered canvas frame by frame. Once the capture has been completed, a result panel will be displayed containing all the information you may need.
The bottom of the menu helps capturing what is happening during the page load on the first canvases present in the document. You can easily choose the number of commands to capture, as well as specify whether or not you would like to capture transient context (context created in the first canvas, even if not part of the DOM).
Note: A few reasons might prevent you capturing the context, the main one being that nothing is rendered if the scene is fully static. If this happens, moving the camera after pressing the capture button should be enough to start the capture.
Note: As collecting the information is pretty expensive, the capture may take a long time and you might have to press wait... a few times when the browser notifies you that the page is unresponsive. Unfortunately, we cannot work around this, as the capture needs to happen synchronously during the execution of your code. Without a synchronous capture, the rest of your code continues to react to external events with potential side effects on the capture.
Capture View
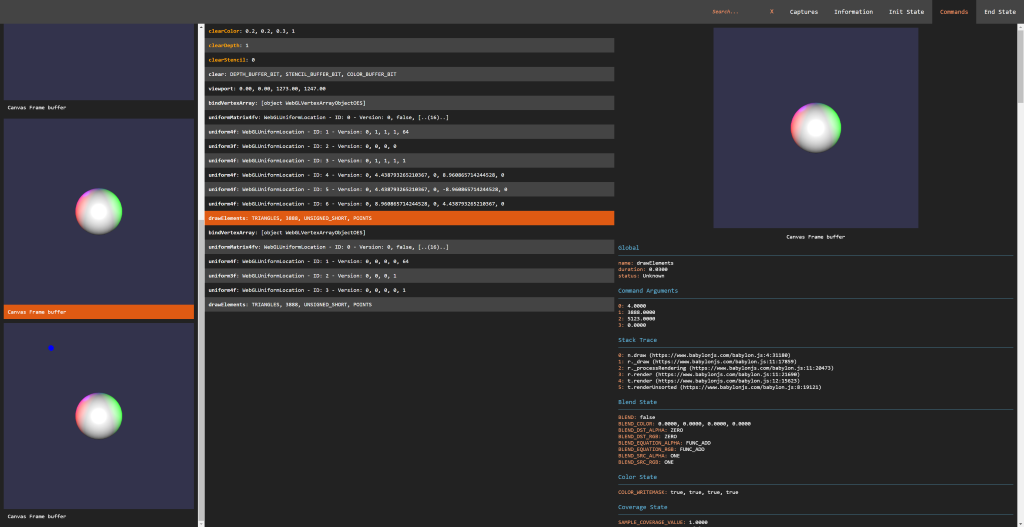
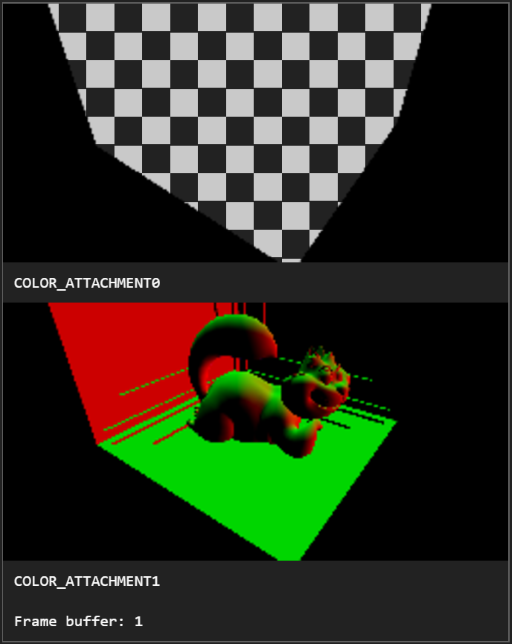
On the left side of the screen are displayed all the different visual state changes happening during the creation of the frame. They are displayed alongside their target frame buffer information. This helps to quickly understand how the frame has been built during troubleshooting sessions. Selecting one of the pictures automatically selects the command associated with it. The visual capture handles all the possible renderable outputs such as cube textures, 3D textures, draw buffers, render target texture, render buffers and so on.
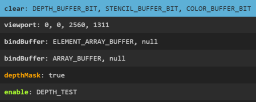
The central panel is the commands panel. It displays the list of commands that were executed on the captured context during the frame. These are displayed chronologically. A color code is used to highlight issues and identify draw calls:
- Orange Background: The selected command.
- Blue Background: Draw Calls or Clear commands.
- Green Command Name: Valid Commands (changing state to a new value).
- Orange Command Name: Redundant Commands (meaning the value applied is the same as the current one which is useful to optimize a WebGL application)
- Red Command Name: Deprecated WebGL Commands.
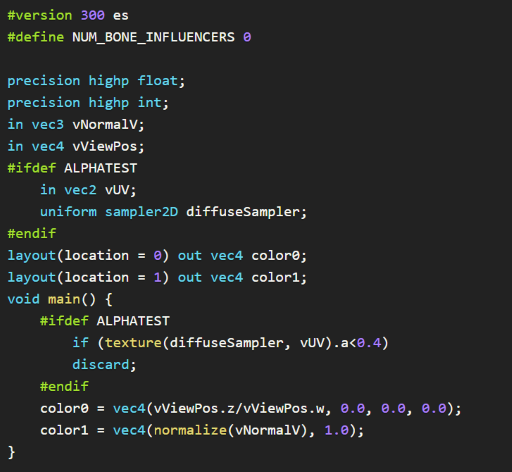
Selecting a command leads to display on the right side all of its detailed information including the command name, arguments, and JavaScript call stack. If a draw call has been selected, the various states involved in this call are all available. This is usually a pretty long list of information, as the captures contains the exhaustive list of states, attachments, programs, shaders, attributes, VAOs, uniforms, UBOs, transform feedbacks, and their attached properties. From this panel, the shader source code is also available from the program information, by following the Click to open link:

This opens a beautified view of the shader code, helping to ensure the defines and the code itself are as expected:
Note: Some information might be empty if there is an issue in the engine. For instance, unbound textures might lead to empty uniform information for the sampler. This is usually an interesting warning and more analytics are in progress to help highlight such use cases better.
A few other views are available for each capture.
Init and End State
Once a capture is open, the top command bar includes links to the initial and final state of the capture. This is useful to see how is the context was before the capture and at the end, to help deal with issues happening between frames, for instance.
Context and Frame Information
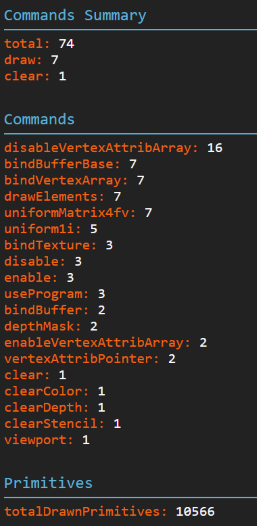
Commonly there are issues in WebGL applications related to either the canvas or the context setup. To be sure the current setup is correct, the information panel displays all the queryable information. This also contains statistics about the captured frame such as memory information, number of calls of each command, and drawn primitive information.
Sharing Captures
Since we often collaborate with others on projects or use multiple platforms, it is critical to be able to save and share captures. To do this, you can simply navigate to the Captures link in the menu, where all the captures of the session have been stored. Clicking on the floppy icon (nostalgia FTW) downloads the captured JSON file.

To open and view this file, Drag and Drop it on the Extension popup or the Capture list dedicated area. This feature can save a lot of time troubleshooting customer or cross-platform issues.
How to Compare Captures
As it is needed more often than anybody would like, comparing captures after an engine change is a must-have. A full capture comparison is currently under development, but in the meantime, captures can at least be put in different tabs of the browser, making it easier to check differences.
Checking the box in the popup menu forces the next capture to open in a new tab:

Custom Data
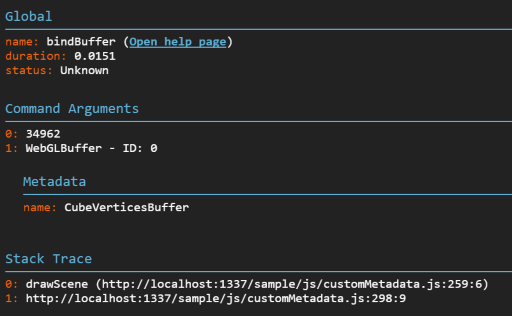
Displaying custom information is a nice trick to quickly identify the relationship between a material and its shader or between a mesh and its buffers. Adding custom data to the capture is achievable by adding a special field named __SPECTOR_Metadata to any WebGLObject. Once the field has been set, any command relying on this object displays the related metadata in the property panel.
javascript var cubeVerticesColorBuffer = gl.createBuffer();

cubeVerticesColorBuffer.__SPECTOR_Metadata = { name: "cubeVerticesColorBuffer" };
This enables the visibility of the custom name “cubeVerticesColorBuffer” in the capture Metadata wherever the buffer is in use.
Extension Control
Another interesting feature is the ability to drive the extension by code. Once the extension is enabled, from your browser’s dev tools, or even your code, you can call the following APIs on “spector.”:
captureNextFrame(obj: HTMLCanvasElement | RenderingContext) : Call to begin a capture of the next frame of a specific canvas or context.startCapture(obj: HTMLCanvasElement | RenderingContext, commandCount: number) : Start a capture on a specific canvas or context. The capture will stop once it reaches the number of commands specified as a parameter, or after 10 seconds.stopCapture(): ICapture : Stop the current capture and returns the result in JSON. It displays the result if the UI has been displayed. This returns undefined if the capture has not been completed or did not find any commands.setMarker(marker: string) : Adds a marker that is displayed in the capture, helping you analyze the results.clearMarker() : Clears the current marker from the capture for any subsequent calls.
The “spector” object is available on the window for this purpose.
This can be a tremendous help to capture the creation of your shadow maps, for instance. This can also be used to trigger a capture based on a user interaction or to set markers in your code to better analyse the capture.
The following example could be introduced safely in your code:
if (spector) {
    spector.setMarker("Shadow map creation");
}
[your shadow creation code]
if (spector) {
    spector.clearMarker();
}
Using the Standalone Version
If you prefer to use the library in your own application you can find it available on npm: spectorjs
Going Further
This extension being pretty new and under active development, a few features have been discussed for the next releases:
- Capture Comparison
- Image Comparison
- Remote Debugging
- Shader Editor
SpectorJS Links
- Website
- Github
- Roadmap
- Report Issues
- Twitter @SpectorJS
I would like to particularly thank Eric Haines for the time spent to review the article, knowing the challenge it represents considering my English 🙂