Seven Things for October 24, 2017

Machine learning, and especially deep learning, is all the rage, so here are some (vaguely) graphics-related tie ins:

Book “WebGL Insights” now free

The book WebGL Insights is now free to download as a PDF. Go get it.

Many of the articles are, of course, WebGL-centric, but some articles in the Rendering Section have general interest, especially for mobile developers. WebGL is “trailing edge,” in that it’s tied to OpenGL ES 2.0, which is what most mobile devices run. So techniques in that section will run in mobile apps in general. WebGL 2 (not covered in this book) is ES 3.0, basically, and current has 22% phone support and 8% tablet support – tablets don’t get refreshed as rapidly as phones.


IKEA Reality

I ran across this article from 2014, which is a worthwhile read about IKEA’s transition from real-world photography to virtual. It had an interesting quote:

…the real turning point for us was when, in 2009, they called us and said, “You have to stop using CG. I’ve got 200 product images and they’re just terrible. You guys need to practise more.” So we looked at all the images they said weren’t good enough and the two or three they said were great, and the ones they didn’t like were photography and the good ones were all CG! Now, we only talk about a good or a bad image – not what technique created it.”

Debugging WebGL with SpectorJS

by Sebastien Vandenberghe

With the emerging number of experiences built using WebGL, and all the improvements made in the WebVR/AR space, it is critical to have efficient debugging tools. Whether you are just starting out or are already an experienced developer of 3D applications with WebGL, you likely know how tools can be important for productivity. Looking for such tools, you probably came across Patrick Cozzi’s blog post highlighting the most common ones. Unfortunately, many of these tools are no longer compatible with your project, due to missing WebGL2 features or extensions, such as draw buffers, 3D textures, and so on.

As a core contributor to BabylonJS, working at the engine level, on a daily basis I need to see the entire creation of frames, including all the available information from the WebGL state (Depth, Stencil, Blend, etc.) as well as the list of commands along with their arguments. In order to optimize the engine, I also need information and statistics about memory, draw calls, and primitives. These desires were a big motivation for me to develop SpectorJS. And as we love the WebGL community we decided to make it an Open Source Project, compatible with all existing WebGL 3D engines.

At the end of this walkthrough, you will be able to easily capture and inspect any WebGL frames rendered in your favorites applications. If you have any issues, do not hesitate to report them on Github. To stay informed of all the new features, follow us at @SpectorJS.


Table of Contents

Installation

Always looking to save time, the tool is directly available as a browser extension: ChromeFirefox – (more browsers are coming soon)

Embedding the library in your application or side-loading the extension are also possible. More information can be found on Github.

Basic Usage

Once installed, you can now on navigate to any website using WebGL, such as the Babylon JS playground, and you will notice the extension Icon turning red in the toolbar.

This highlights the presence of a canvas with a 3D context in the page or its embedded IFrames. Pressing the toolbar button reloads the page and the icon turns green, as Spector is now ready to capture. During the refresh Spector injects additional debug code that collects state and command information, along with other statistics.

Note: We do not enable it by default, so as to not interfere with any WebGL program unless explicitly requested.

Clicking this green button will display a popup helping you to capture frames.

Following the on-screen instructions and clicking the red circle will trigger a capture. If a canvas is selected, you can also, in this menu, pause or play  the rendered canvas frame by frame. Once the capture has been completed, a result panel will be displayed containing all the information you may need.

The bottom of the menu helps capturing what is happening during the page load on the first canvases present in the document. You can easily choose the number of commands to capture, as well as specify whether or not you would like to capture transient context (context created in the first canvas, even if not part of the DOM).


Note: A few reasons might prevent you capturing the context, the main one being that nothing is rendered if the scene is fully static. If this happens, moving the camera after pressing the capture button should be enough to start the capture.

Note: As collecting the information is pretty expensive, the capture may take a long time and you might have to press wait... a few times when the browser notifies you that the page is unresponsive. Unfortunately, we cannot work around this, as the capture needs to happen synchronously during the execution of your code. Without a synchronous capture, the rest of your code continues to react to external events with potential side effects on the capture.

Capture View

On the left side of the screen are displayed all the different visual state changes happening during the creation of the frame. They are displayed alongside their target frame buffer information. This helps to quickly understand how the frame has been built during troubleshooting sessions. Selecting one of the pictures automatically selects the command associated with it. The visual capture handles all the possible renderable outputs such as cube textures, 3D textures, draw buffers, render target texture, render buffers and so on.

The central panel is the commands panel. It displays the list of commands that were executed on the captured context during the frame. These are displayed chronologically. A color code is used to highlight issues and identify draw calls:

  • Orange Background: The selected command.
  • Blue Background: Draw Calls or Clear commands.
  • Green Command Name: Valid Commands (changing state to a new value).
  • Orange Command Name: Redundant Commands (meaning the value applied is the same as the current one which is useful to optimize a WebGL application)
  • Red Command Name: Deprecated WebGL Commands.

Selecting a command leads to display on the right side all of its detailed information including the command name, arguments, and JavaScript call stack. If a draw call has been selected, the various states involved in this call are all available. This is usually a pretty long list of information, as the captures contains the exhaustive list of states, attachments, programs, shaders, attributes, VAOs, uniforms, UBOs, transform feedbacks, and their attached properties. From this panel, the shader source code is also available from the program information, by following the Click to open link:

This opens a beautified view of the shader code, helping to ensure the defines and the code itself are as expected:

Note: Some information might be empty if there is an issue in the engine. For instance, unbound textures might lead to empty uniform information for the sampler. This is usually an interesting warning and more analytics are in progress to help highlight such use cases better.

A few other views are available for each capture.

Init and End State

Once a capture is open, the top command bar includes links to the initial and final state of the capture. This is useful to see how is the context was before the capture and at the end, to help deal with issues happening between frames, for instance.

Context and Frame Information

Commonly there are issues in WebGL applications related to either the canvas or the context setup. To be sure the current setup is correct, the information panel displays all the queryable information. This also contains statistics about the captured frame such as memory information, number of calls of each command, and drawn primitive information.

Sharing Captures

Since we often collaborate with others on projects or use multiple platforms, it is critical to be able to save and share captures. To do this, you can simply navigate to the Captures link in the menu, where all the captures of the session have been stored. Clicking on the floppy icon (nostalgia FTW) downloads the captured JSON file.

To open and view this file, Drag and Drop it on the Extension popup or the Capture list dedicated area. This feature can save a lot of time troubleshooting customer or cross-platform issues.

How to Compare Captures

As it is needed more often than anybody would like, comparing captures after an engine change is a must-have. A full capture comparison is currently under development, but in the meantime, captures can at least be put in different tabs of the browser, making it easier to check differences.

Checking the box in the popup menu forces the next capture to open in a new tab:

Custom Data

Displaying custom information is a nice trick to quickly identify the relationship between a material and its shader or between a mesh and its buffers. Adding custom data to the capture is achievable by adding a special field named __SPECTOR_Metadata to any WebGLObject. Once the field has been set, any command relying on this object displays the related metadata in the property panel.

javascript var cubeVerticesColorBuffer = gl.createBuffer();
cubeVerticesColorBuffer.__SPECTOR_Metadata = { name: "cubeVerticesColorBuffer" };

This enables the visibility of the custom name “cubeVerticesColorBuffer” in the capture Metadata wherever the buffer is in use.

Extension Control

Another interesting feature is the ability to drive the extension by code. Once the extension is enabled, from your browser’s dev tools, or even your code, you can call the following APIs on “spector.”:

  • captureNextFrame(obj: HTMLCanvasElement | RenderingContext) : Call to begin a capture of the next frame of a specific canvas or context.
  • startCapture(obj: HTMLCanvasElement | RenderingContext, commandCount: number) : Start a capture on a specific canvas or context. The capture will stop once it reaches the number of commands specified as a parameter, or after 10 seconds.
  • stopCapture(): ICapture : Stop the current capture and returns the result in JSON. It displays the result if the UI has been displayed. This returns undefined if the capture has not been completed or did not find any commands.
  • setMarker(marker: string) : Adds a marker that is displayed in the capture, helping you analyze the results.
  • clearMarker() : Clears the current marker from the capture for any subsequent calls.

The “spector” object is available on the window for this purpose.

This can be a tremendous help to capture the creation of your shadow maps, for instance. This can also be used to trigger a capture based on a user interaction or to set markers in your code to better analyse the capture.

The following example could be introduced safely in your code:

if (spector) {
    spector.setMarker("Shadow map creation");
}
[your shadow creation code]
if (spector) {
    spector.clearMarker();
}

Using the Standalone Version

If you prefer to use the library in your own application you can find it available on npm: spectorjs

Going Further

This extension being pretty new and under active development, a few features have been discussed for the next releases:

  • Capture Comparison
  • Image Comparison
  • Remote Debugging
  • Shader Editor
  1. Website
  2. Github
  3. Roadmap
  4. Report Issues
  5. Twitter @SpectorJS

I would like to particularly thank Eric Haines for the time spent to review the article, knowing the challenge it represents considering my English 🙂

GPU Zen == Two Cups of Joe

The book GPU Zen is out. Go get it. This is a book edited by Wolfgang Engel and is essentially the successor to the GPU Pro series. Github code is here.

(Update: there’s a call for participation for GPU Zen 2.)

Full disclosure: I edited one small section, on VR. I forget if I am getting paid in some way. I probably get a free copy if I ask nicely. But, the e-book version is $9.99! So I simply bought one. Not $89.99, as books of this type usually are (even for the electronic edition), but rather the price of two coffees.

It’s a Kindle book. Unlike the GPU Pro and ShaderX books, it’s self-published. It’s mostly meant as an e-book, though you can buy a paperback edition if you insist.

So what’s in the book? Seventeen articles on interactive rendering techniques, in good part by practitioners, and nine have associated code. The book’s 360 pages. As you probably know from similar books, for any given person, most of the articles will be of mild interest at best. There will be a few that are worth knowing about. Then there will be one or two that are gold, that help with something you didn’t know about, or didn’t know how to do, or heard of but didn’t want to reinvent.

For example, Graham Wihlidal’s article “Optimizing the Graphics Pipeline with Compute” is a much-expanded and in-depth explanation of work that was presented at GDC 2016. Trying to figure out his work from the slideset is, I guess, theoretically possible. Now you don’t have to, as Graham lays it all out, along with other insights since his presentation, in a 44 page article. At $89.99, I might want to read it but would think twice before getting it (and I have done so in the past – some books of this type I still haven’t bought, if only one article is of interest).

The detailed explanation of XPerf, ETW, and GPUView in the article by James Hughes et alia on VR performance tuning might instead be the one you find invaluable. Or the two articles on SSAO, or one on bokeh depth-of-field, or – well, you get the idea. Or possibly none of them, in which case you’re out a small bit of cash.

For the whole table of contents, just go to the book’s listing and click on the cover to “Look Inside.”

Me, I usually prefer books made of atoms. But for technical works, if I have to choose, I’m happier overall with electronic versions. For these “collections of articles” books in particular, the big advantage of the e-book is searchability. No more “I vaguely recalls it’s in this book somewhere, or maybe one of these three books…” and spending a half-hour flipping through them all. Just search for a term or some particular word and go. Oh, one other cute thing: you can loan the e-book to someone else for 14 days (just once, total, I think).

At $9.99, it’s a minimal-brainer. Order by midnight tomorrow and you’ll get the Ginzu knife set with it. I’ll try to avoid being too much of a huckster here, but honestly, so cheap – you’d have money left for Pete Shirley’s ray tracing e-books, along with Morgan McGuire’s Graphics Codex. I like low-cost and worthwhile. Addendum: if you do buy the paperback, the Kindle “Matchbook” price for the e-book is $2.99. Which is how I think reality should be: buy the expensive atoms one, get the e-book version for a little more, vs. paying full price for each.

7 Colossal Things for May 15, 2017

Haven’t done any “seven things” for a year, so it’s time. This one will just be stuff from the wonderful site This Is Colossal, dedicated to odd ways of making art.

No deep “man’s inhumanity to man” art-with-a-capital-A here, but rather some lovely samples from this wonderful site.


Everything is Triangles

I was entertained to see that the new NVIDIA HQ is triangle inspired. Great quote from an interesting article about new technology company offices:


“At this point I’m kind of over the triangle shape, because we took that theme and beat it to death,” admits John O’Brien, the company’s head of real estate, who pointedly vetoed a colleague’s recent suggestion to offer triangle-shaped water bottles in the cafeteria.

High Performance Graphics 2017 Call for Participation

The High-Performance Graphics 2017 conference call for participation is here.

Summary: deadline for papers is Friday April 21st. Conference itself is Friday-Sunday, July 28-30, colocated with SIGGRAPH in Los Angeles.

For me, this is one of the two great conferences each year for interactive rendering related papers (SIGGRAPH’s papers selection, for whatever reasons, seems to have mostly moved on to other things).

Moving Graphics Research into Development

guest post by Patrick Cozzi, @pjcozzi

[This is a eat your veggies/floss your teeth type of article. Nothing revolutionary; rather, good advice if you don’t already know it, and better advice if you do and need a reminder or may have missed a trick. My only “eat with your mouth closed” addition would be, “add comments as you go,” mainly because I’m wading through someone’s poorly-commented code this week. Your bonus payoff for reading this article through is seeing some nice visualizations at the end. – Eric]

The Penn graphics students I work with on MS thesis, senior design, and GPU course projects and my colleagues working on Cesium are all implementing fairly recent graphics research.

This article presents tips for implementing research that I have learned through hands-on development and through mentoring students and practitioners. There seems to be a huge difference in productivity depending how how we navigate papers and how we approach implementing them.

Implementation is a great way to generate new ideas, but this article is not specifically about generating new research; it is about utilizing existing research to solve a particular problem.

Finding Papers

A quick Google search usually provides prominent papers. I also check Ke-Sen Huang’s website, which has papers from SIGGRAPH, I3D, Eurographics, and several other conferences.

Once you have a good paper, finding more is easy:

  • Follow the references backwards to the seminal work.
  • Go to each author’s website and institute’s website and check their publications. For example, for point clouds, I like the work by Enrico Gobbetti at CRS4.
  • Search for the paper on Google Scholar and trace the most prominent papers that cite it. Google Scholar is also useful for searching papers published in the past n years, which is great for culling old papers, e.g., CLOD terrain algorithms that are no longer appropriate for today’s GPUs.
  • Ask for recommended papers on twitter, seriously.

Quickly identifying and avoiding irrelevant papers is key to staying focused in the right direction.

How to Read a Paper

Skim it first

Assuming I have some understanding of the topic, it takes me about three hours to review an eight-page paper submission for a conference or journal.

When I’m not reviewing for a committee, and instead looking for papers on a particular topic, I don’t read a paper that carefully on the first pass. When I first started reading papers, I spent too much time reading papers that were tangential. This lead to a lot of wasted time going down dead-end paths.

Instead, I suggest reviewing the figures and reading the Abstract, Introduction, and Results sections before dedicating time to a complete read. Also check out the video, demo, and source code if available. You may quickly find that the approach won’t work for you because, for example, it is not fast enough for real-time, relies on features not supported by your target graphics API, relies on an expensive preprocess step, etc. With that said, reading related though tangential papers, if you have the time, still generates potentially useful ideas.

Understand the previous work

If the paper appears relevant, but I don’t have the background to fully understand it, I try to find the seminal work reference in the Previous Work section and read it. Google Scholar can help here since it will report how many times a paper was cited, a useful measure but not ground truth. If you follow the preview work far enough, you may end up with a paper written in the 1970s or 80s, which are fun to read for their simplicity (by today’s standards) and influence. For example, enjoy Particle Systems – A Technique for Modeling a Class of Fuzzy Objects, 1983, by William Reeves.

Survey papers and the Previous Work chapters in PhD/MS theses are also great places to look for background. They distill down each relevant paper to its essence and give a framework for the subject. For example, A Developer’s Survey of Polygonal Simplification Algorithms (2001, David Luebke) and Technical Strategies for Massive Model Visualization (2008, Enrico Gobbetti, Dave Kasik, and Sung eui Yoon) lead to the bulk of the work I read for my MS thesis.

Iterate

Once I’ve found a paper that I think I want to implement, I often need to read it – or at least parts of it – multiple times to gain a solid understanding.

I interleave reading with implementation. Reading deepens my understanding to help me code, and coding deepens my understanding to help me read.

If you have the luxury of no other outside work, you might start the morning coding without even checking email, then check email after lunch, and then spend the afternoon reading so you have fresh ideas for coding the next morning. You’ll quickly have more ideas than time. Choose carefully and keep a record of those not yet examined. Often, when I go back at look at my notes, I am happy that I didn’t spend time on many of the ideas that, in retrospect, would not have been as impactful.

Reach out

Paper authors are often easily accessible via email or twitter. Ask them a specific question that shows you’ve done your research, and they are likely to reply. After all, they are interested in the same topic as you. They know their work very well; one time, an author found a bug in our translucency implementation just by looking at a screenshot!

How to implement research

The following advice applies to coding in general, but I think it is particularly relevant to implementing graphics research with non-trivial data structures and algorithms.

Start small and iterate

Don’t implement the whole paper at once. Implement the smallest useful – or even not so useful – feature, verify that it works, and build on it, verifying the results each step of the way. Get something working first, then make it fast and robust.

Verify, verify, verify. Double check the code flow in the debugger, measure the performance early, and test with simple scenarios before complex ones. When the students in our GPU course implement a rasterizer, they start with a triangle model, then a box, and then the COLLADA duck.

Implementing an out-of-core spatial data structure? Start with an in-core one. Implementing a complex GPU algorithm? Perhaps starting with a CPU implementation first is useful and gives us something to benchmark against.

As the code starts to stabilize, add unit tests. For this type of work, I don’t add unit tests too soon since they would break often.
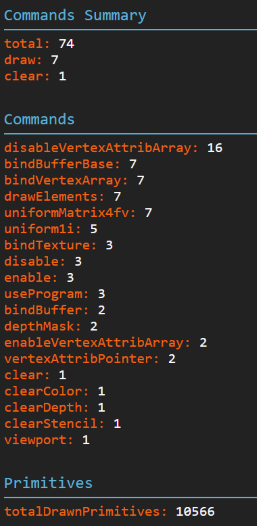
Report statistics

At the start, take the time to add code to report key statistics about the algorithm.

For example, in the out-of-core spatial data structures we use for streaming massive 3D models, we track the number of nodes in memory, nodes visited, nodes rendered, number of pending network requests, number of received requests that are processing, etc.

Watching these stats gives us a very quick indicator if things are working properly. When I wrote the cache replacement algorithm to unload nodes from memory, I first added the relevant stats reporting so I could monitor them during development. I also started with a super-simple test case with a cache size of 1 or 2 tiles.

Test parameters

Also at the start, make it simple to tune key parameters. If your using JavaScript, dat.GUI makes it really easy to map a UI to variables.

Tuning parameters is great for understanding an algorithm, testing our implementation’s robustness, and performance testing, e.g., quickly seeing how changing the number of dynamic lights impacts a deferred shading engine.

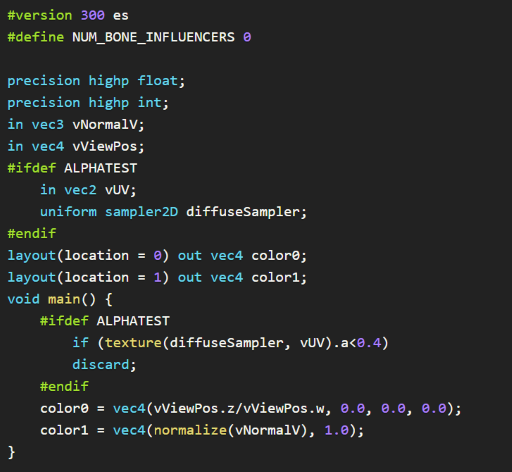
[Note: the full-sized images can be downloaded from the article’s repo. – Eric]


Renderer with debug options to turn on/off different parts of the pipeline and debug views.

Visualize everything

As graphics developers, we love to see the results of our code. Debugging aids that visualize results are just as enjoyable, and can yield deeper insights and intuition. Some examples:

  • bounding volumes
  • wireframe
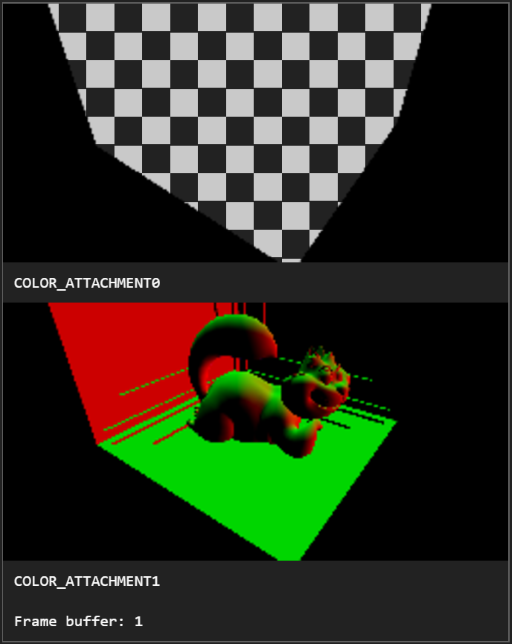
  • g-buffers in a deferred shader
  • tiles in a tile-based deferred shader
  • freeze frame to review culling results
  • shadow maps, including cascades

A couple of examples:

Left: Grand Canyon. Right: Wireframe showing skirts used to avoid cracks between tiles, how high frequency areas are more finely triangulated, and some sense of overdraw.

Left: View of Crater Lake (186 draw calls). Right: Freeze frame viewing tiles with their tile coordinates from a different perspective. Images from Graphics Tech in Cesium – The Graphics Stack.

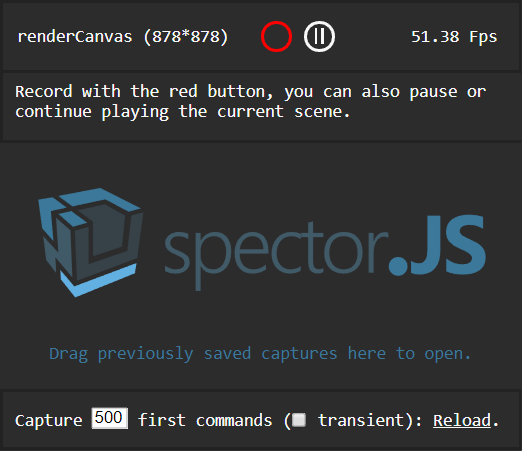
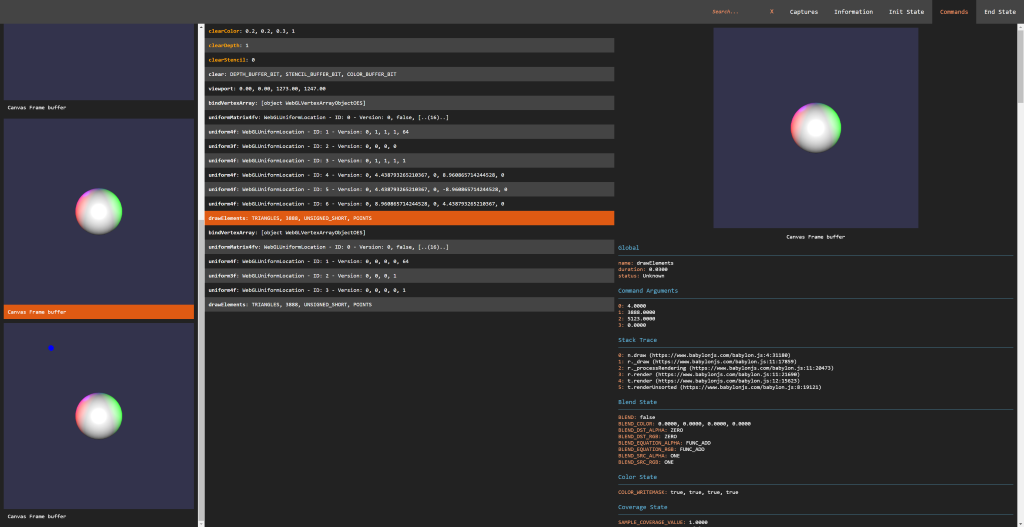
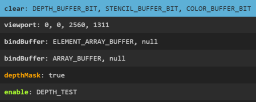
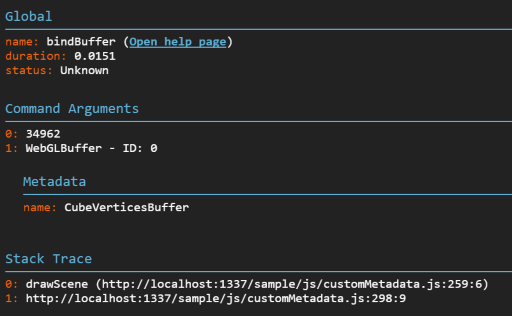
Sometimes a graphics API debugging tool such as Renderdoc or WebGL Inspector is enough to review buffers, textures, shaders, etc. I also find engine-specific tools useful since they are higher-level, e.g., they may color objects based on a shadow-map cascade, whereas a graphics API tool may just show the shadow-map textures. Time spent on and using tools always pays for itself in fewer bugs, deeper performance insights, and creating screenshots for documentation and even twitter.

Debug visualizations are useful because when we can visualize something, an insight often becomes obvious. For example, look at how bad bounding spheres for Cesium’s terrain tiles are compared to oriented bounding boxes.

A visualization gives us an immediate sense, then our stats reporting gives precise numbers. For example, note how the visualization below complements the statistics for using fog to optimize terrain rendering by culling tiles in the far distant and increasing the geometric error for tiles in the mid-distance.

Write

I thought I knew a lot about virtual globe rendering until I tried to coauthor a book about it; 520 pages later, I knew the topic much better and had lots of new ideas. Whether it is a blog post, paper, or entire book, writing deepens our understanding and helps us generate new ideas. It also helps the field move forward as we build on each other’s work.

Real-World Sampling “Artifact”

[A repost, due to WordPress weirdness – sorry about that. Note to self: don’t paste images into WordPress, always upload and insert them.]

I’m seeing this more and more in my neighborhood in the evening:

shadows
It’s the shadow of a tree on pavement, superimposed 3 times. It’s because they’ve been installing new LED streetlights with 3 bulbs.

Hard for me to photograph the light source well, but a reflection of some sort in the camera shows the three bulbs in the upper right:

light

It’s like the artifacts you see when anyone tries to approximate an area light with point lights. So with the advent of LEDs, I guess we won’t need light area sampling algorithms as much?

Maybe one for the Real Artifacts gallery.