Seven Things for February 1, 2014

Here we go:

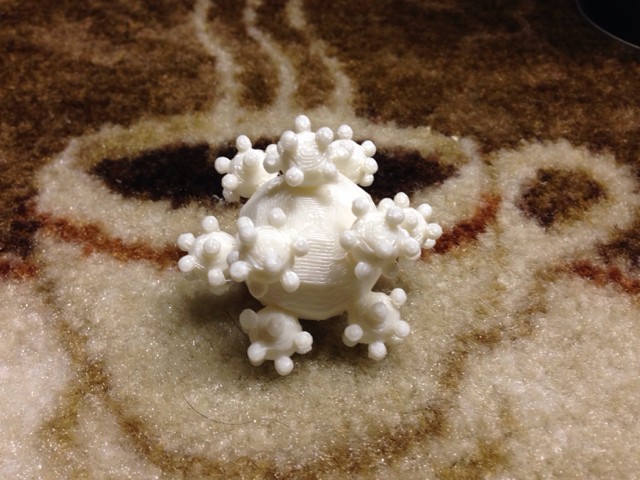
3D Printed Sphereflake

Well, it’s not printed in silver or steel or somesuch, but it’s still fun to see. This is from Alexander Enzmann, who did a lot of work on the SPD model software, outputting a wide variety of formats. Since the spheres in the sphereflake normally touch each other at only one point, he modified the program a bit to push the spheres only 80% of the way along their axis translation, so giving more overlap between each pair. He printed this on his Solidoodle printersphereflake

512 and counting

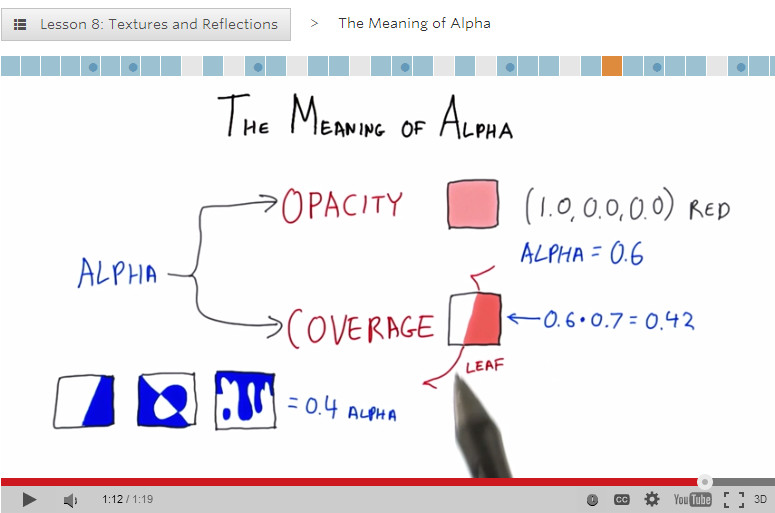
I noticed I reached a milestone number of postings today, 512 answers posted to the online Intro to 3D Graphics course. Admittedly, some are replies to questions such as “how is your voice so dull?” However, most of the questions are ones that I can chew into. For example, I enjoyed answering this one today, about how diffuse surfaces work. I then start to ramble on about area light sources and how they work, which I think is a really worthwhile way to think about radiance and what’s happening at a pixel. I also like this recent one, about z-fighting, as I talk about the giant headache (and a common solution) that occurs in ray tracing when two transparent materials touch each other.

So the takeaway is that if you ever want to ask me a question and I’m not replying to email, act like you’re a student, find a relevant lesson, and post a question there. Honestly, I’m thoroughly enjoying answering questions on these forums; I get to help people, and for the most part the questions are ones I can actually answer, which is always a nice feeling. Sometimes others will give even better answers and I get to learn something. So go ahead, find some dumb answer of mine and give a better one.

By the way, I finally annotated the syllabus for the class. Now it’s possible to cherry-pick lessons; in particularly, I mark all lessons that are specifically about three.js syntax and methodology if you already know graphics.

alpha

HPG CFP 2014

Really, you just need this link. I think HPG is the most useful conference I keep tabs on, from a “papers that can help me out” standpoint. SIGGRAPH’s better for a “see what’s happening in the field as a whole” view, and often there’s useful stuff in the courses and sketches, but in the area of papers HPG far outstrips SIGGRAPH in the number of papers directly useful to me. I can’t justify going as often as I like (especially when it’s in Europe), but HPG’s a great conference.

Anyway, here’s the CFP boilerplate, to save your precious fingers from having to click on that link (it’s actually amazing to me how much links are not clicked on; in my own life I tend to consider clicking on a link something of a commitment).

High-Performance Graphics 2014 is the leading international forum for performance-oriented graphics and imaging systems research including innovative algorithms, efficient implementations, languages, parallelism, compilers, hardware and architectures for high-performance graphics. High-Performance Graphics was founded in 2009, synthesizing multiple conferences to bring together researchers, engineers, and architects to discuss the complex interactions of parallel hardware, novel programming models, and efficient algorithms in the design of systems for current and future graphics and visual computing applications.

The conference is co-sponsored by Eurographics and ACM SIGGRAPH. The 2014 program features three days of paper and industry presentations, with ample time for discussions during breaks, lunches, and the conference banquet. It will be co-located with EGSR 2014 in Lyon, France, and will take place on June 23—25, 2014.

Topics include:

  • Hardware and systems for high-performance graphics and visual computing
    • Graphics hardware simulation, optimization, and performance measurement
    • Shading architectures
    • Novel fixed-function hardware design
    • Hardware for accelerating computer
    • Hardware design for mobile, embedded, integrated, and low-power devices
    • Cloud-accelerated graphics systems
    • Novel display technologies
    • Virtual and augmented reality systems
  • High-performance computer vision and image processing techniques
    • High-performance algorithms for computational photography, video, and computer vision
    • Hardware architectures for image and signal processors (ISPs)
    • Performance analysis of computational photography and computer vision applications on parallel architectures, GPUs, and specialized hardware
    • Programming abstractions for graphics
      • Interactive rendering pipelines (hardware or software)
      • Programming models and APIs for graphics, vision, and image processing
      • Shading language design and implementation
      • Compilation techniques for parallel graphics architectures
      • Rendering algorithms
        • Spatial acceleration data structures
        • Surface representations and tessellation algorithms
        • Texturing and compression/decompression algorithms
        • Interactive rendering algorithms (hardware or software)
        • Visibility algorithms (ray tracing, rasterization, transparency, anti-aliasing, …)
        • Illumination algorithms (shadows, global illumination, …)
        • Image sampling strategies and filtering techniques
        • Scalable algorithms for parallel rendering and large data visualization
        • Parallel computing for graphics and visual computing applications
          • Physics and animation
          • Novel applications of GPU computing

Important Dates:

  • Paper submission deadline: April 4, 2014
  • Notification of acceptance: May 12, 2014
  • Camera-ready papers due: May 22, 2014
  • Conference: June 23—25, 2014

More information: www.HighPerformanceGraphics.org


Long Plane Rides and JCGT

I’m about to embark on a 20-hour (or so) plane trip to Shanghai. With most of that time being in the plane, I’m loading up on stuff to read on my iPad. (Tip: GoodReader is great for copying files from your DropBox to your iPad.) JCGT does a great job of helping me fill up. Just go to the “Read” area and there’s a long list of articles, select the ones that sound interesting, and download away (well, having all the papers be called “paper.pdf” is not ideal, but that will eventually get fixed). No messing around with logging in, no digging to find things, just “here’s a nicely-illustrated list, have at it”. It’s amazing to me how much the little illustrations help me quickly trim the search.

In contrast, I had to do a few minutes of clever searching to find the SIGGRAPH 2013 Proceedings. Shame on you, ACM DL, for not responding properly to the searches “SIGGRAPH 2013” or “SIGGRAPH 2013 papers”. The first search shows everything but the papers, since the papers are part of TOG; the second search gives practically random results.

Some Presents for Xmas

Here are a few cool things I noticed and seem appropriate to post today.

First, this person is doing cool real-life procedural texturing. Or I should say, is really covering up, since we know the aliens are the ones who are really making these.

The Graphics Codex now has three sample PDFs available for free download, to give you a sense of what’s in the app/book. Find the links in the right-hand column.

The Christmas Experiments gives 24 little graphical presents, scroll down to make them appear. I haven’t opened them all up yet, as I was working backward and only got as far as this one, which is lovely and interactive.

Merry
xmas

Improved Graphics Transforms Demo

With the holidays upon us, it’s time to hack! Well, a little bit. I spent a fair bit of time improving my transforms demo, folding in comments from others and my own ideas. Many thanks to all who sent me suggestions (and anyone’s welcome to send more). I like one subtle feature now: if the blue test point is clipped, it turns red and clipping is also noted in the transforms themselves.

The feature I like the most is that which shows the frustum. Run the demo and select “Show frustum: depths”. Admire that the scene is rendered on the view frustum’s near plane. Rotate the camera around (left mouse) until it’s aligned to a side view of the view frustum. You’ll see the near and far plane depths (colored), and some equally spaced depth planes in between (in terms of NDC and Z-depth values, not in terms of world coordinates).

side

Now play with the near and far plane depths under “Camera manipulation” (open that menu by clicking on the arrow to the left of the word “Camera”). This really shows the effect of moving the near place close to the object, evening out the distribution of the plane depths. Here’s an example:

side2

The mind-bender part of this new viewport feature is that if you rotate the camera, you’re of course rotating the frustum in the opposite direction in the viewport, which holds the view of the scene steady and shows the camera’s movement. My mind is constantly seeing the frustum “inverted”, as it wants both directions to be in the same direction, I think. I even tried modeling the tip where the eye is located, to give a “front” for the eye position, but that doesn’t help much. Probably a fully-modeled eyeball would be a better tipoff, but that’s way more work than I want to put into this.

You can try lots of other things; dolly is done with the mouse wheel (or middle mouse up and down), pan with the right mouse. All the code is downloadable from my github repository.

Click on image for a larger, readable version.

transforms4

Graphics Pipeline Demo

Try it out (you have to have WebGL enabled etc.)

2013-12-19_220205

I made this demo as a few students of the Interactive Graphics MOOC were asking for something showing the various transforms from beginning to end.

It’s not a fantastic demo (yet), but if you roughly understand the pipeline, you can then look at a given point and see how it goes through each transform.

It’s actually kind of a fun puzzle or guessing game, if you understand the transforms: if I pan, what values will change? What if I change the field of view, or the near plane?

I’d love suggestions. I can imagine ways to help guide the user with what various coordinate transforms mean, e.g. putting up a pixel grid and labeling it when just the window coordinates transform is selected, or maybe a second window showing a side view and the frustum (but I’m not sure what I’d put in that window, or what view to use for an arbitrary camera).

I’ve been bumping into limitations of three.js as it is, but I’m on a roll so that’s why I’m asking.


WebGL Debugging and Profiling Tools

by Patrick Cozzi, who works on the Cesium WebGL engine.

With the new shader editor in Firefox 27 (available now in Aurora), WebGL tools are taking a big step in the right direction. This article reviews the current state of WebGL debugging and profiling tools with a focus on their use for real engines, not simple demos. In particular, our engine creates shaders dynamically; uses WebGL extensions like Vertex Array Objects; dynamically creates, updates, and deletes 100’s of MB of vertex buffers and textures; renders to different framebuffers; and uses web workers. We’re only interested in tools that provide useful results for our real-world needs.

Firefox WebGL Shader Editor

The Firefox WebGL Shader Editor allows us to view all shader programs in a WebGL app, edit them in real-time, and mouse over them to see what parts of the scene were drawn using them.

What I like most about it is it actually works. Scenes in our engine usually have 10-50 procedurally-generated shaders that can be up to ~1,000 lines. The shader editor handles this smoothly and automatically updates when new shaders are created.

skybox

The skybox shader is shown in the editor and the geometry is highlighted in red. (Click on any image for its full-screen version.)

I was very impressed to see the shader editor also work on the Epic Citadel demo, which has 249 shaders, some of which are ~2,000 lines.

citadel

Live editing is, of course, limited. For example, we can’t add new uniforms and attributes and provide data for them; however, we can add new varying variables to pass data between vertex and fragment shaders.

Given that the editor needs to recompile after our edits, attribute and uniform locations could change, e.g., if uniforms are optimized out, which would break most apps (unless the app is querying these every frame, which is a terrible performance idea). However, the editor seems to handle remapping under-the-hood since removing uniforms doesn’t break other uniforms.

Recompiling after typing stops works well even for our large shaders. However, every editor I see like this, including JavaScript ones we’ve built, tends to remove this feature in favor of an explicit run, as the lag can otherwise be painful.

There are some bugs, such as mousing over some shaders causes artifacts or parts of the scene to go away, which makes editing those shaders impossible.

artifacts

Even though this is in a pre-beta version of Firefox, I find it plenty usable. Other than spot testing, I use Chrome for development, but this tool really makes me want to use Firefox, at least for shader debugging.

We planned to write a tool like this for our engine, but I’m glad the Mozilla folks did it instead since it benefits the entire WebGL community. An engine-specific tool will still be useful for some. For example, this editor uses the shader source provided to WebGL. If a shader is procedurally-generated, an engine-specific editor can present the individual snippets, nodes in a shade tree, etc.

A few features that would make this editor even better include:

  • Make boldface any code in #ifdef blocks that evaluate to true. This is really useful for ubershaders.
  • Mouse over a pixel and show the shader used. Beyond debugging, this would be a great teaching aid and tool for understanding new apps. I keep pitching the idea of mousing over a pixel and then showing a profile of the fragment shader as a final project to my students, but no one ever bites. Easy, right?
  • An option to see only shaders actually used in a frame, instead of all shaders in the WebGL context, since many shaders can be for culled objects. Taking it a step further, the editor could show only shaders for non-occluded fragments.

For a full tutorial, see Live editing WebGL shaders with Firefox Developer Tools.

WebGL Inspector

The WebGL Inspector was perhaps the first WebGL debugging tool. It hasn’t been updated in a long time, but it is still useful.

WebGL Inspector can capture a frame and step through it, building the scene one draw call at a time; view textures, buffers, state, and shaders; etc.

The trace shows all the WebGL calls for a frame and nicely links to more info for function arguments that are WebGL objects. We can see the contents and filter state of textures, contents of vertex buffers, and shader source and current uniforms.

ducktrace

ducktexture

One of WebGL Inspector’s most useful features is highlighting redundant WebGL calls, which I use often when doing analysis before optimizing.

redundant

Like most engines, setting uniforms is a common bottleneck for us and we are guilty of setting some redundant uniforms for now.

WebGL Inspector may take some patience to get good results. For our engine, the scene either isn’t visible or is pushed to the bottom left. Also, given its age, this tool doesn’t know about extensions such as Vertex Array Objects. So, when we run our engine with WebGL Inspector, we don’t get the full set of extensions supported by the browser.

The WebGL Inspector page has a full walkthrough of its features.

Chrome Canvas Inspector

The Canvas Inspector in Chrome DevTools is like a trimmed-down WebGL Inspector built right into Chrome. It is an experimental feature but available in Chrome stable (Chrome 31). In chrome://flags/, “Enable Developer Tools experiments” needs to be checked and then the inspector needs to be explicitly enabled in the DevTools settings.

Although it doesn’t have nearly as many features as WebGL Inspector, Canvas Inspector is integrated into the browser and trivial to use once enabled.

canvasinspector

Draw calls are organized into groups that contain the WebGL state calls and the affected draw call. We can step one draw group or one WebGL call at a time (all WebGL tracing tools can do this). The scene is supposed to be shown one draw call at a time, but we currently need to turn off Vertex Array Objects for it to work with our engine. Canvas Inspector can also capture consecutive frames pretty well.

The inspector is nicely integrated into the DevTools so, for example, there are links from a WebGL call to the line in the JavaScript file that invoked it. We can also view the state of resources like textures and buffers, but not their contents or history.

Tools like WebGL Inspector and Canvas Inspector are also useful for code reviews. When we add a new rendering feature, I like to profile and step through the code as part of the review, not just read it. We have found culling bugs when stepping through draw calls and then asking why there are so many that aren’t contributing to any pixels.

For a full Canvas Inspector tutorial, see Canvas Inspection using Chrome DevTools.

Google Web Tracing Framework

The Google Web Tracing Framework (WTF) is a full tracing framework, including support for WebGL similar to WebGL Inspector and Canvas Inspector. It is under active development on github; they addressed an issue I submitted in less than a day! Even without manually instrumenting our code, we can get useful and reliable results.

Here we’re stepping through a frame one draw call at a time:

wtf

For WebGL, WTF has similar trace capability as the above inspectors, combined with all its general JavaScript tracing features. The WebGL trace integrates nicely with the tracks view.

tracks

Above, we see the tracks for frame #53. The four purple blocks are texture uploads using texSubImage2D to load new imagery tiles we received from a web worker. Each call is followed by several WebGL state calls and a drawElements call to reproject the tile on the GPU (see World-Scale Terrain Rendering from the Rendering Massive Virtual Worlds SIGGRAPH 2013 course). The right side of the frame shows all the state and draw calls for the actual scene.

Depending on how many frames the GPU is behind, a better practice would be to do all the texSubImage2D calls, followed by all the reprojection draw calls, or even move the reprojection draw calls to the end of the frame with the scene draw calls. The idea here is to ensure that the texture upload is complete by the time the reprojection draw call is executed. This trades the latency of completing any one for the throughput of computing many. I have not tried it in this case so I can’t say for certain if the driver lagging behind isn’t already enough time to cover the upload.

gc

The tracks view gets really interesting when we examine slow frames highlighted in yellow. Above, the frame takes 27ms! It looks similar to the previous frame with four texture uploads followed by drawing the scene, but it’s easy to see the garbage collector kicked in, taking up almost 12ms.

linkProgram

Above is our first frame, which takes an astounding 237ms because it compiles several shaders. The calls to compileShader are very fast because they don’t block, but the immediate call to linkProgram needs to block, taking ~7ms for the one shown above. A call to getShaderParameter or getShaderInfoLog would also need to block to compile the shader. It is a best practice to wait as long as possible to use a shader object after calling compileShader to take advantage of asynchronous driver implementations. However, testing on my MacBook Pro with an NVIDIA GeForce 650M did not show this. Putting a long delay before linkProgram did not decrease its latency.

For more details, see the WTF Getting Started page. You may want to clear a few hours.

More Tools

The WebGL Report is handy for seeing a system’s WebGL capabilities, including extensions, organized by pipeline stage. It’s not quite up-to-date with all the system-dependent values for the most recent extensions, but it’s close. Remember, to access draft extensions in Chrome, we need to explicitly enable them in the browser now. For enabling draft extensions in Firefox you need to go to “about:config” and set the “webgl.enable-draft-extensions” preference to true.

webglreport

The simple Chrome Task Manager (in the Window menu) is useful for quick and dirty memory usage. Make sure to consider both your app’s process and the GPU process.

taskmanager

Although I have not used it, webgl-debug.js wraps WebGL calls to include calls to getError. This is OK for now, but we really need KHR_debug in WebGL to get the debugging API desktop OpenGL has had for a few years. See ARB_debug_output: A Helping Hand for Desperate Developers in OpenGL Insights.

There are also WebGL extensions that provide debugging info to privileged clients (run Chrome with –enable-privileged-webgl-extensions). WEBGL_debug_renderer_info provides VENDOR and RENDERER strings. WEBGL_debug_shaders provides a shader’s source after it was translated to the host platform’s native language. This is most useful on Windows where ANGLE converts GLSL to HLSL. Also see The ANGLE Project: Implementing OpenGL ES 2.0 on Direct3D in OpenGL Insights.

The Future

The features expected in WebGL 2.0, such as multiple render targets and uniform buffers, will bring us closer to the feature-set OpenGL developers have enjoyed for years. However, API features alone are not enough; we need an ecosystem of tools to create an attractive platform.

Building WebGL tools, such as the Firefox Shader Editor and Chrome Canvas Inspector, directly into the browser developer tools is the right direction. It makes the barrier to entry low, especially for projects with limited time or developers. It helps more developers use the tools and encourages using them more often, for the same reason that unit tests that run in the blink of an eye are then used frequently.

The current segmentation of Google’s tools may appear confusing but I think it shows the evolution. WebGL Inspector was first out of the gate and proved very useful. Because of this, the next generation version is being built into Chrome Canvas Inspector for easy access and into the WTF for apps that need careful, precise profiling. For me, WTF is the tool of choice.

We still lack a tool for setting breakpoints and watch variables in shaders. We don’t have what NVIDIA Nsight is to CUDA, or what AMD CodeXL is to OpenCL. I doubt that browser vendors alone can build these tools. Instead, I’d like to see hardware vendors provide back-end support for a common front-end debugger built into the browser.

Paper Books are Heavy and Have a Volume

I’m moving to the Boston area on Monday. One of the 258 tasks I’ve done in preparation is to deal with my bookshelves at work. I donated 13 boxes of books and journals to the Program of Computer Graphics at Cornell:

pile o' books

I’m glad they took them – who knows, maybe they’ll eventually toss most of the piles in the recycling bin (despite the sign), but at least I won’t know about it. Me, I kept my ShaderX/GPU Pro and GPU Gems series books along with a few others. I’ve enjoyed accumulating a large computer graphics library over 30 years. Raise your hand if you remember Newman & Sproull – wow, you’re old (I kept that one for nostalgia’s sake). However, once it came down to actually moving these heavy boxes and finding a spot for them all in a home office, well…

In my perfect world I pay for a book once and have it accessible to me forever, in digital form so it’s easily searchable (and weighs nothing and takes up no shelf space). Kindle’s system is getting there, but kind of a pain, you have to install an application on your PC to look at your book collection, then download each book in full if you want to examine it. Strangely, from your Amazon account you can look at the parts you highlighted in a Kindle book you own, but not the book itself. (As an aside, there are some interesting stories I see arising over the next decade, such as “Amazon proves Freddy Fredhead is deceased and so deletes his Kindle account; family mourns”.)

The Graphics Codex, which has been mentioned in this blog in the past, is pretty close to that perfect world…but it used to only be on iOS. At the time it came out only my wife had an iPad, so my copy of the Codex is tied to her device. This limitation has changed in the past week: the codex is now available as a separate web edition. Pay for it, log in from anywhere, and it’s at your fingertips. There are external links to many different resources and articles. About my only complaint is waiting 2-5 seconds for a section to first load – yes, Time Warner Cable, we consumers would like faster internet connections like they have in highly developed countries such as Latvia, and I hope Google buries you (or you wake up and do some things better and be less monopolistic).</rant> After a section’s loaded it appears to be cached and is more like a second delay to fade in.

This computer graphics reference looks great and has a bit about a large number of topics. What’s particularly nice is knowing that this resource is growing and improving over time. You can even make suggestions for new sections to Morgan McGuire, its author. He’s also made it clear that the material is “Subject to Fair Use” in the About section of the Codex. Of course, every printed work is subject to fair use, but I take this explicit wording to mean I could snip a diagram or equation and use it in a classroom lecture (and credit it), later put the lecture up on the web, and not be concerned about a Cease and Desist takedown letter coming my way. Fun fact: as of today, there are 911,708 C&D notices in Chilling Effect’s database (and that collection is mostly just those received by Google).

This is a nice feature of the web edition: you can snip from the pages. One downside is that all the lovely formatting comes at a cost: you can’t copy and paste the text characters themselves from the pages displayed. That’s mostly a quibble – I need this functionality only for code, which I probably won’t want in the same style as shown, anyway. All in all, I’m happy to buy this reference in this form, knowing I can access it at any time on any device.

And there are some nice things to snip; feast your squinties on these screenshots – click on an image for the full resolution version. The Graphics Codex is not a perfect final form of all that I’d like in a book (e.g., I can’t bookmark, highlight, write in the margins), but it’s definitely a step along the way, especially in terms of accessibility, quality, and price ($10).

Graphics Codex 1

Graphics Codex 3

Graphics Codex 2 Graphics Codex 4